Monday, April 27, 2009

Concept Map


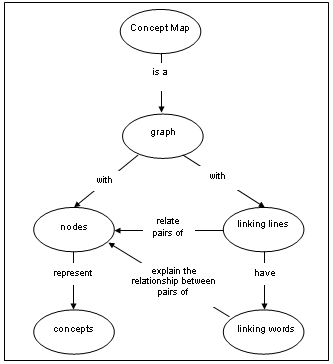
Concept maps create a visual picture to explain words or ideas. For example this map shows the idea of a Concept map. Concept maps seek to organizes words and ideas into a hierarchical structure

http://redie.uabc.mx/contenido/vol2no1/art-11-eng/contenido-ruiz-figura1.png

Wednesday, April 22, 2009

Univariate choropleth maps


Unlike a Bivariate choropleth map, which displays two unrelated sets of data, a univariate map only displays one variant. In the map above the colors represent the water usage in millions of gallons per day.

Nominal area choropleth map


In this map the colors represent different provinces in Iraq. With each province comes a different political system and varied beliefs. The names of the provinces are clearly marked.

DOQQ

"DOQQs are color infrared images with one meter per pixel resolution. DOQQs are provided in the UTM coordinate system; the DOQQs you have downloaded are in the UTM zone 14 (UTM83-14), and are in MrSID format:" The scale is useful because any viewer will know what size area they are looking at

http://www.fmepedia.com/index.php/Raster_Mosaicking_Scenario
Link to Picture and text

DEM


DEM stands for Digital Elevation Map. This is a form of remote sensing. You can clearly see the mountains, along with many other physical features.
http://eros.usgs.gov/images/dem.jpg

DLG


Digital line Graphics display roads, rivers along with other valuable information. You can use DLGs to navigate around town, or to show proximity of a location.

http://www.mpassociates.gr/software/distrib/science/rock/dlg_plot.jpg

Isopleths


An isopleth map generalizes and simplifies data with a continuous distribution. It shows the data as a third dimension on a map, thus isopleth maps are more common for mapping surface elevations, amounts of precipitation, atmospheric pressure, and numerous other measurements that can be viewed statistically as a third dimension. This map shows Sulfate ion concentration in the U.S.